HiRO-ACEv2: Simulating extreme weather at 3 km resolution for a fraction of the cost
🤗 Models | 📄 Paper | 📓 Tutorial notebooks | 🌎 Demo
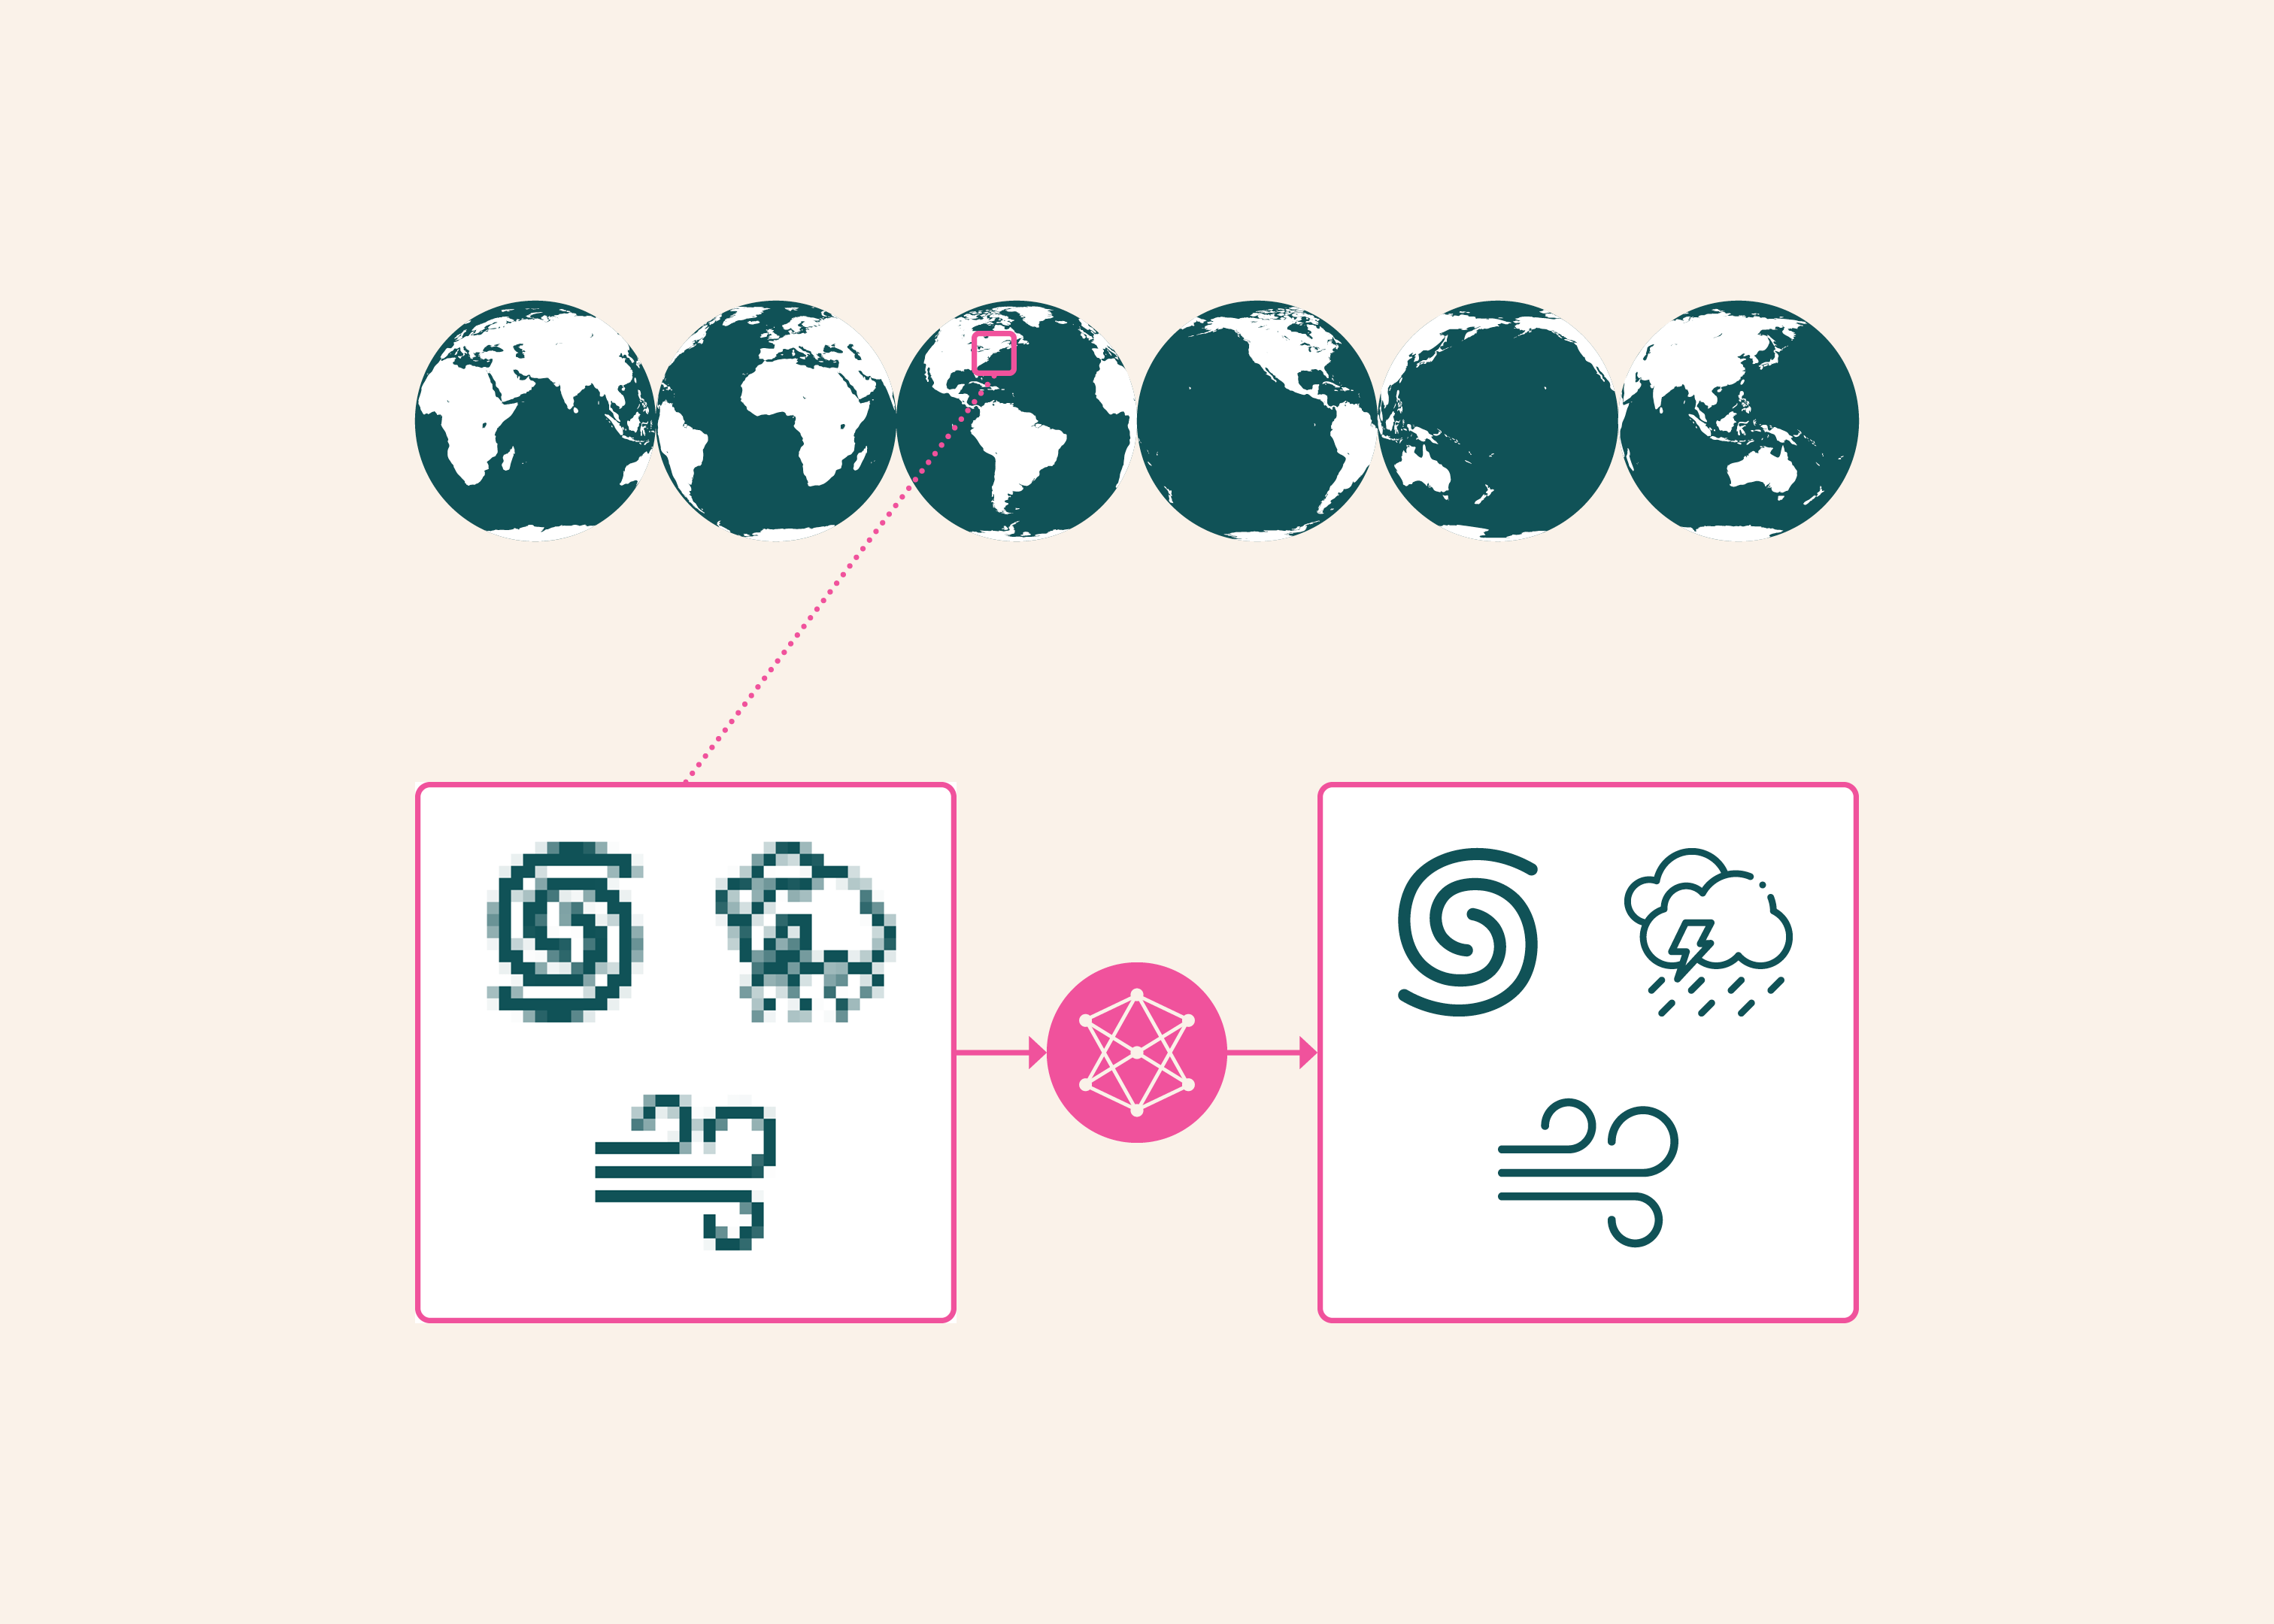
We introduce HiRO-ACEv2, the newest update to our High Resolution Output Ai2 Climate Emulator (HiRO-ACE) system. HiROv2 can reproduce even extremely rare rain, wind, and pressure events with high accuracy, while the full system can generate global 3 km climate data at about 1/300th the cost of X-SHiELD, a high-resolution global atmospheric model that explicitly simulates storms and other small-scale weather.
HiRO-ACE, introduced earlier in 2026, has two parts: ACE, an AI model that operates at a coarser 100 km resolution, and HiRO, a model that sharpens those coarse outputs into fine 3 km detail. The biggest change in HiRO-ACEv2 is the new downscaling model, HiROv2, which can now 1) predict several high-resolution fields at once instead of just rainfall, so it can capture a much wider range of extreme weather, and 2) has improved skill in predicting extreme events.
We also trained an updated version of ACE for this system. Over a 10-year simulation, its hurricanes, average climate patterns, and overall distributions of rain, wind, and pressure all line up well with X-SHiELD. That tells us ACE's coarse simulations are a solid foundation for producing long-term high-resolution climate data.
Putting HiROv2 and ACE together, we generated a full year of global 3 km data. Its statistics closely match X-SHiELD's, even though HiRO was working from a simulation ACE ran on its own rather than from real X-SHiELD data. Across a 10-year run, the energy of HiRO-ACEv2's hurricanes is comparable to X-SHiELD's over the same period, and snapshots from that run show a variety of other extreme events that resemble those in X-SHiELD.
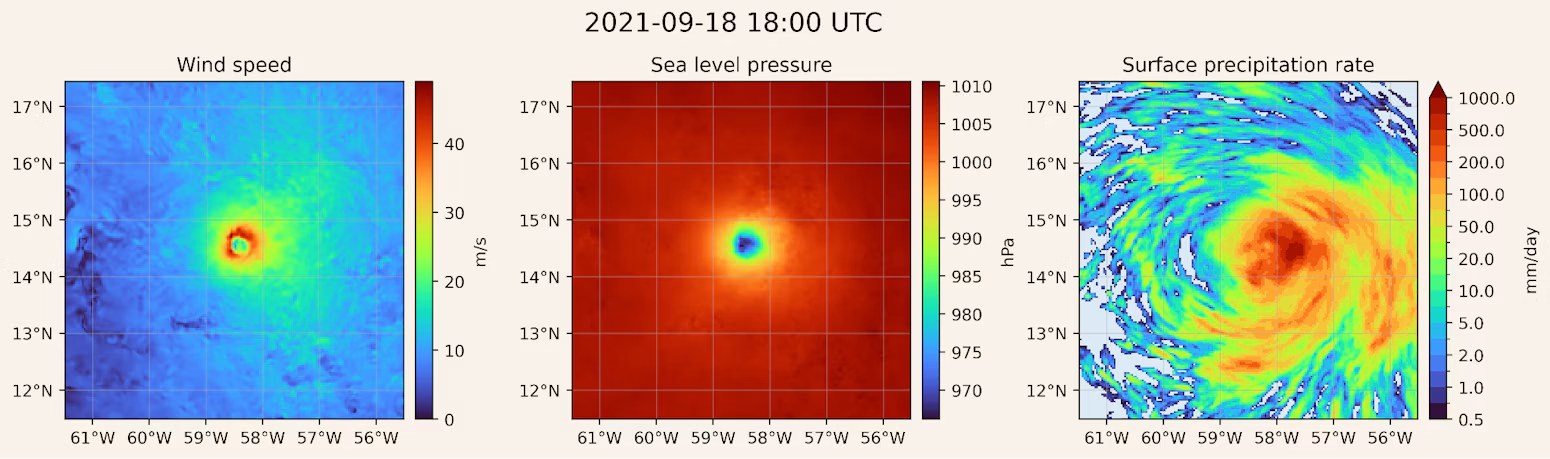
An example of a strong hurricane in the North Atlantic, generated during the 10-year HiRO-ACEv2 simulation.
Overall, HiRO-ACEv2 offers researchers a flexible and inexpensive way to generate many versions of high-resolution rain, wind, and pressure data for extreme events over 10 years or more. Producing global high-resolution data with it costs roughly 300 times less than running X-SHiELD. If only one region is needed, the savings can be more than a hundred times greater, depending on the size of the area. We're also working on a streamlined version of HiROv2 that could make it more than ten times faster still.
We still have future work ahead of us: because HiRO learned from X-SHiELD, it only works with the version of ACE tuned to match X-SHiELD. That means it can't yet produce high-resolution data for other climates, such as a warmer future or the historical record in datasets like ERA5. Next, we plan to train on new X-SHiELD datasets, including one simulating a world 4°C warmer, so the system can handle different climates. We also plan to add outputs like near-surface temperature and snow and ice, which would allow for even more uses, such as snowpack prediction.
Visualizing and using HiRO outputs
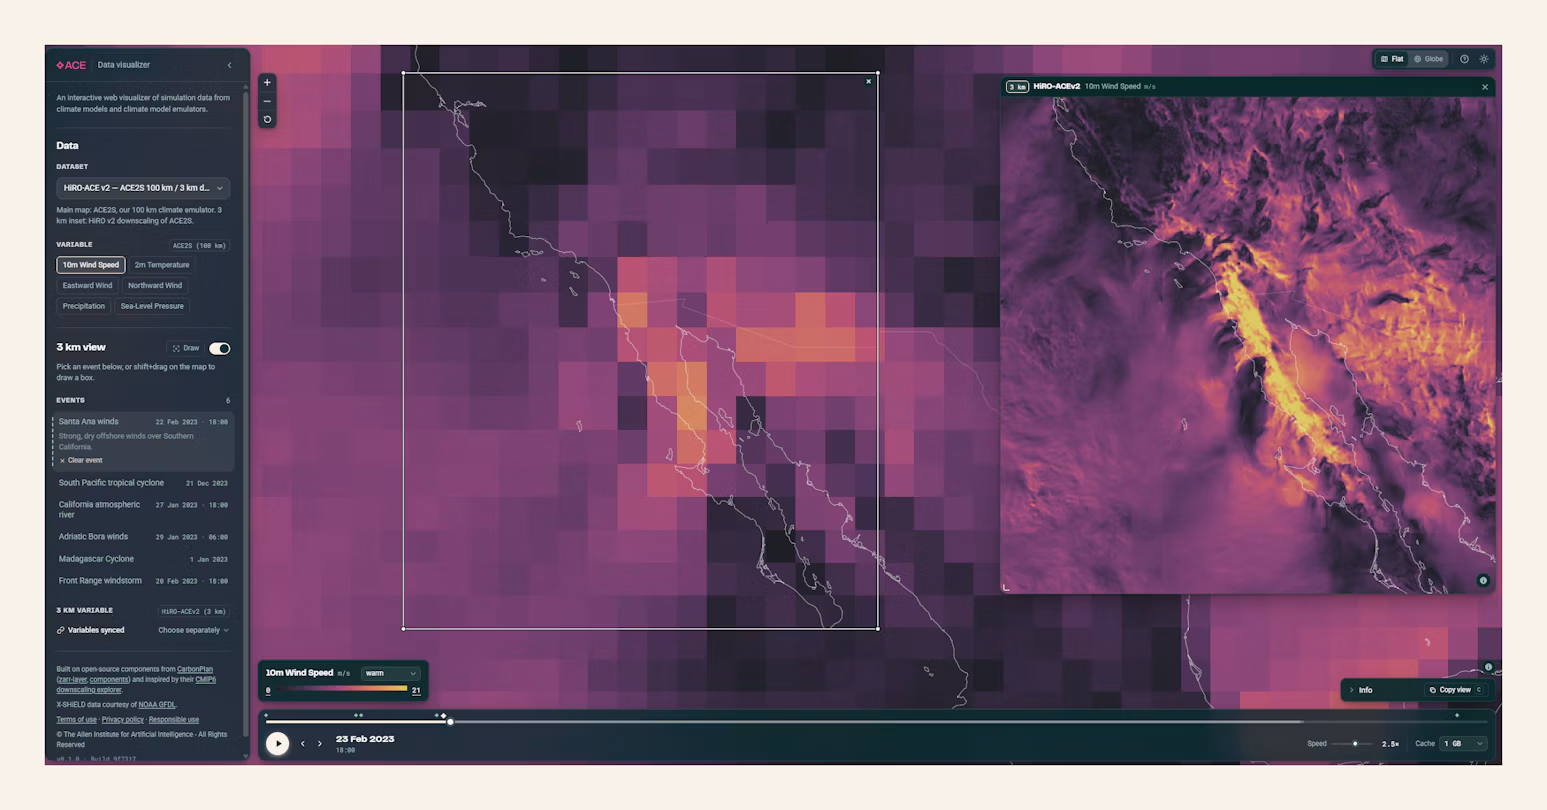
Simulated 10 m wind speed over Baja California in the ACE data visualizer: ACE2 at 100 km resolution on the main map and HiRO-ACEv2 at 3 km in the inset.
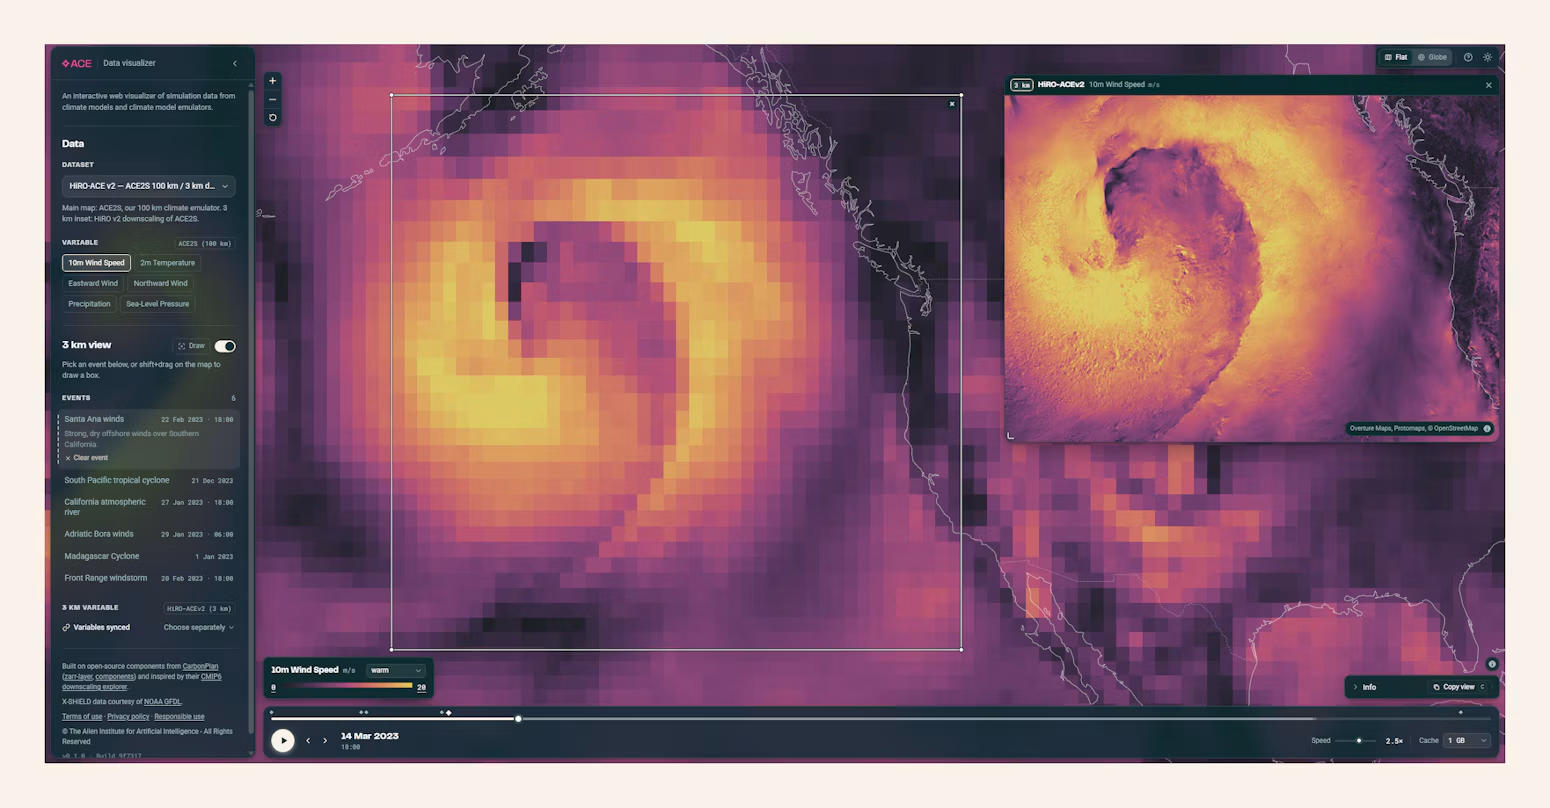
A simulated storm over the northeastern Pacific in the ACE data visualizer. The main map shows 10 m wind speed at 100 km resolution; the 3 km HiRO-ACEv2 inset shows finer structure within the storm.
To make it easy to see what HiRO produces without running any inference, we built a web demo that shows pre-generated precipitation, wind, and sea-level pressure output from HiROv1 and HiROv2 side by side with X-SHiELD, the simulation they were trained on. The demo complements the quantitative comparisons in our tech report: it offers a quick visual check of how the outputs look, and lets users zoom in on their own region of interest to judge performance there.
For more in-depth analysis, the models are available to download, and our tutorial notebooks walk through how to run them.